If you run a trading card vending machine for any length of time, the first thing you learn is that inventory tracking is not a back-office afterthought — it is the entire business. I have spent over a decade placing automated retail units across the US and Europe, and the operators who fail are almost never the ones with bad locations. They are the ones who lose sight of what is actually inside the machine. You can have the best foot traffic in the region, but if you do not know which cards are moving, which are sitting, and what your true cost per unit is, you are not running a business — you are running an expensive hobby. This guide walks through how to track inventory in a trading card vending machine from a practical, operator-level perspective, covering everything from stock counts and sales data to category rotation and seasonal demand.
Why Inventory Tracking Makes or Breaks a Card Vending Operation
Most newcomers assume a vending machine is a set-and-forget revenue stream. In card vending, that assumption is dangerous. Unlike snack machines, where a bag of chips has a long shelf life and predictable demand, trading cards are a trend-driven, SKU-heavy product. A box that sells out in a week can become dead stock in a month. Without a disciplined tracking system, you are flying blind.
I have seen operators with three machines in high-traffic malls lose money because they kept restocking the same slow-moving Pokémon sets while their sports card compartment sat empty. The data was right there in front of them — but they were not tracking it. The ones who succeed treat every slot like a small retail shelf, reviewing velocity, margin, and restock frequency weekly.
Inventory tracking in a trading card vending machine is not just about counting what is left. It is about understanding what your local market wants, when they want it, and at what price point they will clear it. That requires a system — whether it is a spreadsheet, a cloud-based inventory tool, or the machine’s own telemetry — that gives you a clear picture of each product’s lifecycle.
The Core Metrics You Need to Track
Before you even think about software or sensors, you need to define what “tracking” means for your operation. Over the years, I have narrowed it down to five core metrics that matter more than anything else. These are the numbers I check every single week, and they are the same numbers I teach every operator I work with.
SKU Velocity and Turnover Rate
SKU velocity tells you how fast each specific card or pack is selling. You calculate this by dividing the number of units sold in a period by the average inventory on hand. If a $5 booster pack sells 20 units a week and you carry 40, your turnover rate is 0.5 — that is solid. If another SKU sells 2 units a week and you carry 30, you are tying up capital in dead stock.
I have found that the top 20% of SKUs in a typical card vending machine generate about 70% of the revenue. That is a rough number from my own operations, not a published statistic, but it has held true across every machine I have run. The implication is clear: you need to identify those fast movers and keep them stocked, while aggressively pruning the slow sellers.
Gross Margin Per Slot
Gross margin per slot is the money you make after accounting for the wholesale cost of the cards, the transaction fees, and the electricity. It sounds simple, but many operators forget to factor in the cost of the machine itself and the location rent. I calculate margin per slot as (retail price – wholesale cost – payment processing fee – allocated overhead) / number of slots.
In my experience, a healthy card vending slot generates between $15 and $45 in gross margin per month, depending on the location and the card category. If a slot is below $10, I either change the product or reconsider the machine’s placement. This kind of per-slot analysis is the only way to decide whether a machine is worth keeping.
Restock Frequency and Labor Cost
Every time you visit a machine, you are spending time and gas. If you are restocking every three days because one SKU is flying, that labor cost eats into your margin. I have seen operators make the mistake of restocking too often, treating the machine like a retail store with daily shelf-stocking. In vending, you want to maximize the interval between service visits while minimizing stockouts.
My rule of thumb is to aim for a restock cycle of 7 to 10 days for most locations. If a machine sells through its top SKU in four days, I either increase the capacity for that SKU or raise the price slightly to slow the velocity. The goal is balance, not constant trips.
Real-World Failure: The Case of the Overstocked Sports Card Machine
Let me give you a concrete example from my own early days. I placed a 32-inch touchscreen trading card vending machine in a suburban hobby shop that had a loyal customer base. The shop owner was enthusiastic, and the location had decent foot traffic. I loaded it with a mix of sports cards, Pokémon, and a few specialty sets. The first two weeks were fantastic — sales were strong, and I thought I had cracked the code.
Then things started to slow down. I noticed that the sports card compartment was barely moving, but the Pokémon side was selling out. Instead of looking at the data, I assumed it was a seasonal dip and kept restocking the same mix. By week six, I had over $1,800 of dead sports card inventory sitting in the machine, while the Pokémon side was empty and losing sales. That was a hard lesson.
The fix was not complicated. I pulled the slow-moving sports cards, replaced them with a different product mix, and started tracking daily sales reports from the machine’s software. Within a month, the same location was generating 25% more revenue. The machine was not the problem — my inventory tracking was.
Successful Judgment Case: Data-Driven Category Rotation
On the flip side, I have a location in a college town where the customer base shifts dramatically between semesters. During the school year, the demand is heavily skewed toward Pokémon and Yu-Gi-Oh! — the younger crowd. In the summer, when the students leave, the same machine sells almost nothing but sports cards to the local residents.
I learned to track this pattern over two full years. Now, I rotate the inventory mix seasonally, shifting about 60% of the slots to match the expected demand curve. I also adjust the pricing on slower SKUs during off-peak months to encourage faster turnover. That machine has been my most consistent performer, generating an average of $1,400 per month in revenue, with a gross margin of around 35%.
The key was not intuition — it was a structured tracking system that showed me the seasonal trends. Without that data, I would have kept restocking the wrong products and wondering why the summer months were so weak.
How to Choose the Right Tracking System
There are three main ways to track inventory in a trading card vending machine: manual spreadsheets, the machine’s built-in telemetry, and third-party inventory management software. Each has its place, and I have used all three at different stages of my operation.
Manual Spreadsheets
If you are running one or two machines, a well-structured Google Sheets or Excel workbook is often enough. I still use a spreadsheet for my smaller locations because it forces me to look at the numbers carefully. You need columns for SKU, wholesale cost, retail price, units sold, units on hand, restock date, and notes. The downside is that it is easy to fall behind on data entry, especially when you are busy.
Built-in Telemetry and Remote Monitoring
Most modern card vending machines, including the ones I use, come with some level of remote telemetry. This can include real-time sales data, inventory counts per slot, and even alerts for low stock. If your machine supports this, use it. I have seen operators ignore this feature because they prefer manual counting — that is a mistake. The telemetry is your early warning system.
For example, my 32-inch touchscreen unit sends me a daily sales report and flags any slot that has been empty for more than 24 hours. That feature alone saves me hours of travel time and prevents stockouts at high-traffic locations.
Third-Party Inventory Software
When you grow beyond five machines, a dedicated inventory management platform becomes worthwhile. These tools can sync with your machine’s API, track sales across multiple units, and generate restock recommendations. They are not cheap — expect to pay $50 to $150 per month depending on the provider — but they pay for themselves in labor savings and reduced dead stock.
Comparing Tracking Methods: A Practical Table
| Tracking Method | Upfront Cost | Monthly Cost | Labor Required | Best For | Key Risk |
|---|---|---|---|---|---|
| Manual Spreadsheet | Free | None | High — 2–3 hours per week per machine | 1–2 machines, low budget | Data entry errors, forgotten updates |
| Built-in Telemetry | Included in machine price | None | Low — review reports weekly | 3–10 machines | Limited to machine’s own data |
| Third-Party Software | $100–$500 setup | $50–$150 | Low — automated syncing | 10+ machines or multi-site ops | Subscription cost, integration issues |
This table is based on my own experience and typical pricing in the US market as of 2024. Your costs will vary depending on the software provider and the machine model you choose. The important takeaway is that your tracking method should scale with your operation — do not over-invest early, but do not ignore the need for data as you grow.
Location-Based Inventory Strategies
Not all locations behave the same way. A machine in a comic book store will have different sales patterns than one in a mall kiosk or a card shop. You need to adapt your inventory tracking to the specific environment.
High-Foot Traffic Retail Locations
In malls and busy retail corridors, you are dealing with impulse buyers. They are less likely to buy a $20 sealed product and more likely to grab a $3–$5 pack. In these locations, I track velocity very tightly and restock more frequently — sometimes every five days. The margin is lower per unit, but the volume makes up for it.
I also pay close attention to the time of day. A machine near a movie theater will see a spike on Friday and Saturday evenings. If I know that, I can plan my restock schedule for Thursday so the machine is fully loaded before the weekend rush.
Hobby and Card Shop Locations
These are your best locations for higher-priced items. The customers are knowledgeable and often collectors. They will buy single cards, sealed boxes, and specialty sets. In these spots, I track the mix between sealed product and single cards carefully. Sealed product moves slower but has a higher margin. Singles move fast but require more frequent restocking.
I have also found that hobby shop locations benefit from a small display of the newest releases. If you can see what the shop is promoting, you can align your inventory with their marketing. This is a form of tracking that goes beyond your own sales data — it is about understanding the local ecosystem.
Low-Foot Traffic Niche Locations
Sometimes you place a machine in a location that has lower foot traffic but a very dedicated audience — for example, a gaming lounge or a university club room. In these cases, the sales volume is lower, but the customers are consistent. I track these machines less frequently, sometimes every two weeks, and I focus on a narrow SKU range that I know this audience wants.
One mistake I made early on was stocking a niche location with the same broad mix as a mall machine. It did not work. The customers wanted a specific set, and everything else just sat there. Now I treat each low-traffic location as a micro-market, with a tailored inventory list.
The Role of Payment Systems in Inventory Data
Your payment system is not just a way to collect money — it is a data source. Modern card readers and cashless payment systems record every transaction, including the exact product purchased, the time, and the price. If you are not using this data, you are missing out on the most accurate inventory tracking you can get.
I strongly recommend using a cashless payment system that integrates with your machine’s software. This gives you a real-time view of sales, and it eliminates the need for manual entry. In my experience, cashless payments account for about 85% of all transactions in card vending, so the data you get is representative of your actual sales.
One caution: payment processors charge fees, typically 2.9% plus $0.30 per transaction. That fee is worth it for the data alone, but you should factor it into your margin calculations. I have seen operators ignore this fee and then wonder why their profit is lower than expected.
Supplier Selection and Inventory Reliability
Your inventory tracking is only as good as your supply chain. If you cannot get consistent stock, your tracking system will show empty slots and lost sales. Over the years, I have developed a set of criteria for choosing suppliers that goes beyond price.
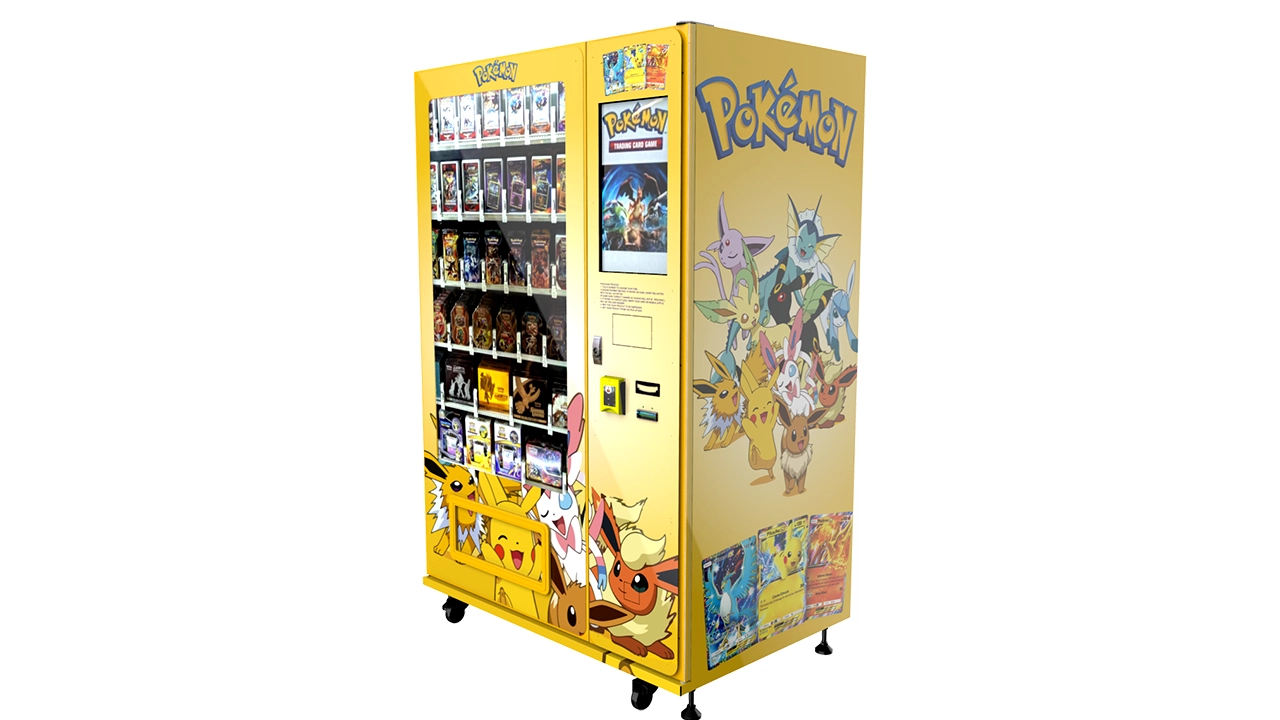
First, look for a supplier who can provide consistent stock of popular sets. The worst thing is to have a customer walk up to your machine, see an empty slot for the newest Pokémon set, and walk away. That is a lost sale, and it damages the machine’s reputation.
Second, consider the lead time. A supplier who can ship within 48 hours is worth more than one who saves you 5% on cost but takes two weeks. I have switched suppliers for this exact reason more than once.
Third, check the supplier’s authenticity guarantees. In the trading card world, counterfeit products are a real risk. You do not want to be the operator selling fake cards — it will destroy your location relationships. I only work with suppliers who provide proof of authenticity and have a track record in the industry.
One supplier I have worked with on several projects is Zhongda Smart, a manufacturer of card vending machines and related equipment. They have been reliable on the hardware side, and their machines come with decent built-in tracking features. I mention them because hardware reliability is part of the inventory equation — if your machine breaks down, you cannot track anything.
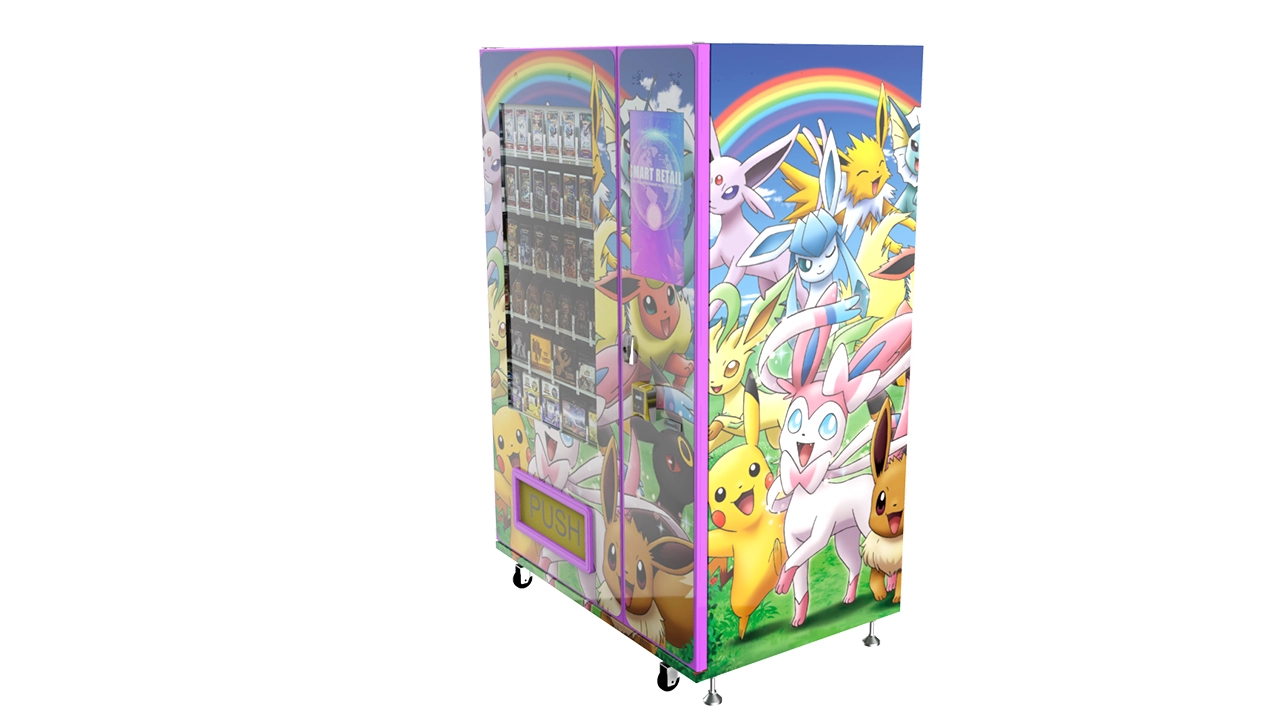
Maintenance and Its Impact on Inventory Accuracy
Let’s talk about machine maintenance, because it directly affects your inventory data. A jammed dispenser or a faulty sensor can cause the system to report incorrect stock levels. You might think you have 10 units of a product when you actually have 3, because two got stuck in the mechanism.
I recommend a monthly physical inventory count, even if your machine has telemetry. This is the only way to catch discrepancies between what the system reports and what is actually in the machine. In my operations, I have found an average discrepancy of 3–5% between telemetry and physical counts, mostly due to jams and miscounts. That is small, but it matters when you are dealing with high-value single cards.
If you are not comfortable doing your own repairs, find a reliable vending machine repair technician before you need one. Waiting until a machine breaks down is a recipe for downtime and lost revenue. I have a list of vetted technicians in each region where I operate, and I have their phone numbers saved in my contacts.
Cost Breakdown and Return on Investment
Now let’s talk numbers, because that is what every operator wants to know. I am going to give you realistic ranges based on my own experience and industry data. Remember, these are estimates — your actual numbers will vary depending on location, foot traffic, product mix, and your own efficiency.
Initial investment for a new card vending machine typically ranges from $3,500 to $8,000, depending on the size, screen configuration, and payment system. A 32-inch touchscreen model with cashless payment will be at the higher end. Used machines can be found for $1,500 to $3,000, but you take on the risk of wear and tear.
Monthly revenue for a well-placed machine is typically between $800 and $2,500. I have seen exceptional locations do more, but that is rare. Your gross margin — after product cost and transaction fees — is usually 30% to 45%. That means a machine generating $1,500 per month in revenue might produce $450 to $675 in gross margin.
Now subtract your location rent (often 10–20% of revenue or a flat fee), electricity, and your own labor. A realistic net profit per machine is $200 to $500 per month. I have operators who do better, and I have operators who barely break even. The difference is almost always in the location and the inventory management.
Payback period for a new machine is typically 12 to 24 months. I have seen it happen in 8 months in a great location, and I have seen it take 3 years in a poor one. Do not believe anyone who promises a 3-month payback — that is not realistic for most operators.
Public Data and Industry Context
To give you some external context, the vending machine industry in the US has been growing steadily. According to Statista, the US vending machine market was valued at over $7 billion in 2023, with a projected annual growth rate of about 4% through 2028. That includes all types of vending, not just cards, but it shows the broader trend.
IBISWorld reports that the vending machine operators industry in the US has around 12,000 businesses, and the average profit margin is approximately 6.5% (source). That number is lower than what I see in card vending, but it reflects the broader industry, including snack and beverage machines with higher overhead.
For European readers, Eurostat data shows that vending machine density in Western Europe is among the highest in the world, with an estimated 1 machine per 1,000 residents in countries like Germany and the Netherlands. This suggests a mature market with strong consumer acceptance of automated retail.
The U.S. Small Business Administration recommends that new operators conduct thorough market research before investing, and I echo that advice. The data I have shared here is a starting point, but you need to analyze your specific location.
Common Inventory Tracking Mistakes to Avoid
After a decade in this business, I have seen the same mistakes repeated by new operators. Let me list the most common ones so you can avoid them.
- Ignoring slow movers: Just because a product sold well once does not mean it will sell again. If a SKU has not moved in 30 days, it is costing you money.
- Overstocking high-value items: A $50 single card might have a great margin, but if it takes two months to sell, you are better off with a faster-moving product.
- Not factoring in machine downtime: If your machine is broken for a week, you are not just losing sales — you are losing data. You cannot track what is not selling because the machine is not selling anything.
- Using inconsistent naming for SKUs: If you call a product “Pokémon Pack” in one spreadsheet and “Pokemon Booster” in another, your data will be a mess. Use a consistent naming convention.
- Ignoring seasonal trends: Trading card sales spike during holidays, new set releases, and school breaks. If you do not anticipate these, you will either run out of stock or overstock.
How to Reduce Restock and Maintenance Costs
Efficiency is the name of the game in vending. The less time you spend on the road, the higher your effective hourly rate. Here are some strategies I use to keep costs down.
First, batch your restock trips by geographic area. If you have machines within a 10-mile radius, plan one route and do all of them in a single day. This sounds obvious, but I have seen operators run out to a machine for a single restock, wasting two hours of driving for one $5 pack.
Second, use the machine’s telemetry to prioritize. If a machine is at 80% capacity but has one empty slot, you do not need to go immediately. If a machine is at 30% capacity and has three empty slots, that is a priority. Let the data tell you where to go.
Third, negotiate with your suppliers for volume discounts. If you can commit to a monthly order volume, most wholesalers will give you a 5–10% discount. That directly improves your margin and offsets some of the costs we discussed.
Finally, consider a maintenance contract for your machines. I pay about $30 to $50 per month per machine for a service plan that covers parts and labor. In my experience, this is cheaper than paying for individual repair calls, which can run $150 to $300 per visit.
Self-Op vs. Lease vs. Revenue Share
One of the biggest decisions you will make is whether to own your machines outright, lease them, or enter a revenue-sharing agreement with a location owner. Each model has different implications for your inventory tracking and your bottom line.
Self-operation gives you full control over inventory and data. You buy the machine, you stock it, you keep all the revenue. The downside is that you bear all the risk and all the maintenance costs. This is the model I prefer for my core locations.
Leasing is a middle ground. You rent a machine from a manufacturer or a leasing company, usually for $100 to $200 per month. This lowers your upfront cost but increases your monthly overhead. You still manage the inventory, so your tracking responsibilities are the same.
Revenue sharing is where the location owner provides the space and sometimes the electricity, and you split the revenue — typically 70/30 or 60/40 in your favor. This model is attractive for high-traffic locations where you want to avoid high rent. However, you need to be very clear about who is responsible for restocking and maintenance, and you need a system to track the split accurately.
Here is a quick comparison table:
| Model | Upfront Cost | Monthly Overhead | Control Over Inventory | Best For |
|---|---|---|---|---|
| Self-Op | $3,500–$8,000 | $50–$200 (rent, electricity) | Full control | Experienced operators, long-term locations |
| Lease | $500–$1,500 (deposit) | $100–$300 (lease + rent) | Full control | New operators testing the market |
| Revenue Share | Low — often just signage | None or minimal | Shared responsibility | High-traffic locations with strong footfall |
Data-Driven Category Rotation and Sales Analysis
Once you have several months of tracking data, you can start making smarter decisions about what to stock. This is where the real power of inventory tracking comes in — it is not just about counting, it is about predicting.
I analyze my sales data every two weeks, looking for trends. For example, I have noticed that certain Pokémon sets have a predictable sales curve: a spike in the first two weeks after release, followed by a gradual decline over the next six to eight weeks. Knowing this, I adjust my order quantities accordingly — I buy more upfront and taper off.
I also use sales data to set pricing. If a SKU has been sitting for 30 days, I will reduce the price by 10–15% to move it. This is not a loss if you have already factored in the margin; it is better to recover 80% of your cost than to hold dead inventory for another month.
For single cards, I track the market value of popular cards using online price guides. If a card’s value has dropped significantly, I mark it down in the machine. If it has spiked, I can raise the price. This dynamic pricing approach has increased my margins by an average of 5–7% across my machines.
FAQ
Are vending machines profitable?
Yes, but not automatically. A well-placed and well-managed card vending machine can generate $200 to $500 in net profit per month. The key is location, product mix, and disciplined inventory tracking. Many operators do not make money because they ignore these factors.
How much does a trading card vending machine cost?
A new machine costs between $3,500 and $8,000, depending on size and features. Used machines can be found for $1,500 to $3,000, but they come with more risk. You should also budget for installation, first inventory, and maintenance.
How long does it take to recoup the investment?
Most operators see a payback period of 12 to 24 months. In exceptional locations, it can be as short as 8 months. In poor locations, it can take 3 years or longer. Do not rely on average figures — calculate your own break-even based on your specific costs and expected revenue.
Should a beginner buy or lease a machine?
If you are new to vending, I recommend leasing or buying a used machine to test the market. This minimizes your upfront risk. Once you have proven a location works, you can invest in a new machine. I have seen many beginners buy multiple new machines and then struggle to find good locations.
Where should I place a card vending machine to maximize income?
Look for locations with high foot traffic and a natural connection to trading cards — hobby shops, comic book stores, gaming lounges, and mall kiosks. The location needs at least 500 to 1,000 people passing by per day to be viable, and you should negotiate rent carefully.
What licenses or permits do I need?
This varies by state and country. In the US, you will typically need a business license, a seller’s permit, and possibly a vending machine permit depending on your city. Check with your local Small Business Administration office for specific requirements. In the EU, the rules vary by country, so consult your local chamber of commerce.
How do I choose a reliable vending machine supplier?
Look for a supplier with a track record, positive reviews, and good after-sales support. Ask for references and visit their facility if possible. I have worked with several suppliers over the years, including Zhongda Smart, and the key is to find someone who stands behind their product.
What should I do if my machine breaks down?
First, have a maintenance contract in place before you need it. If the machine is still under warranty, contact the manufacturer. If not, call a vending machine repair technician. Do not attempt complex repairs yourself unless you have the training — you can make the problem worse.
How can I reduce restock and maintenance costs?
Batch your restock trips by geographic area, use telemetry to prioritize visits, negotiate volume discounts with suppliers, and consider a maintenance contract. These strategies have cut my operating costs by about 20% over the years.
Disclaimer: The figures and operational estimates in this article are based on my personal experience and publicly available industry data. They are provided for general informational purposes only and do not constitute financial advice. Actual results will vary depending on location, market conditions, product mix, and operational efficiency. Always conduct your own market research and consult with a qualified business advisor before making investment decisions.