If you want the short answer on the best drinks for vending machine profit margins, bottled water, energy drinks, and 12 oz cans of carbonated soft drinks consistently outperform everything else on my route. Water costs you roughly $0.25–$0.40 per unit and sells for $1.50–$2.00. Energy drinks cost $1.20–$1.80 and sell for $3.50–$4.50. Those two categories alone generate 60–70% of my gross profit across 140+ machines in mixed retail, warehouse, and office locations. Juice, teas, and sports drinks have their place, but they move slower and expire faster. The ranking below is based on my own route data and may vary significantly by location, foot traffic, and machine type.
Why Drink Selection Drives Vending Profit More Than Machine Choice
I have seen operators spend $8,000 on a top-tier machine and stock it with the wrong drinks. That machine becomes a $300-per-month liability. Conversely, a $2,500 refurbished unit loaded with the right mix can clear $900 in monthly revenue at a warehouse break room.
The machine matters for reliability and payment processing. The drink mix matters for everything else. According to Statista's non-alcoholic beverage outlook, global consumption of bottled water and energy drinks has grown at a compound annual rate of 6–8% since 2019, while traditional carbonated soft drink volume has been flat to slightly declining in North America and Western Europe. That shift shows up directly in vending sales data.
IBISWorld's vending machine operators industry report puts average gross margins for operators at 45–55%, but that figure blends all product categories. Drink-focused machines with the right SKU mix regularly hit 60–68% gross margin. Snack-heavy machines sit closer to 40%.
The Top Drinks Ranked by Real-World Profit Margin
This ranking reflects gross margin per slot, not just markup percentage. A product with a 300% markup that sells twice a week is worse than a product with a 150% markup that sells 15 times a week.
- Bottled water (500ml–600ml) — Highest volume, lowest cost, best margin consistency.
- Energy drinks (250ml–500ml) — Highest dollar profit per unit, strong repeat purchase.
- Carbonated soft drinks (12 oz cans) — Reliable volume, moderate margin, excellent shelf life.
- Sports drinks (500ml–600ml) — Strong in gyms, warehouses, and warm climates.
- Ready-to-drink coffee (cold brew, iced coffee) — Growing category, higher price point, shorter shelf life.
- Juice and juice blends (330ml–500ml) — Decent margin, slower velocity, higher waste risk.
- Bottled tea (unsweetened and lightly sweetened) — Niche demand, inconsistent across locations.
1. Bottled Water: The Volume King
Water is the single most important SKU in any drink machine. In my experience, it accounts for 22–30% of total drink sales in office and warehouse locations. Cost per unit from a wholesale distributor runs $0.22–$0.38 depending on brand and case quantity. Retail price in a vending machine sits at $1.50–$2.00.
That is a gross margin of 75–85%. No other drink category comes close. The catch is that water is heavy and takes up slot space. A 600ml bottle weighs 600g plus packaging. If your machine is a glass-front model with adjustable shelves, water should occupy the bottom two rows for stability and easy restocking.
Expiration dates on water are long — typically 12–24 months — so waste is minimal. The main risk is brand perception. Generic store-brand water at $1.50 sells fine in a warehouse. In a hospital or corporate campus, you may need a recognizable brand to justify $2.00.
2. Energy Drinks: The Profit Engine
Energy drinks deliver the highest absolute profit per unit. A 250ml can of a mainstream brand costs $1.10–$1.60 wholesale and sells for $3.50–$4.50. That is $2.00–$3.00 profit per can.
Velocity depends entirely on location. In a 24-hour warehouse or logistics hub, I have seen energy drinks sell 12–18 units per day per machine. In a quiet office, that drops to 2–4 units. Based on my route data, energy drinks average 15–20% of total drink revenue but 25–30% of total drink profit.
One warning: energy drinks attract theft and shrinkage in unsupervised locations. I have pulled energy drinks from open-access machines in transit stations because the loss rate hit 8–10%. In controlled-access break rooms, shrinkage is under 2%.
3. Carbonated Soft Drinks: The Reliable Middle
Twelve-ounce cans remain the backbone of vending. Wholesale cost is $0.30–$0.50 per can. Vending price is $1.50–$2.00. Gross margin lands at 65–75%.
Cans outsell bottles in most vending setups because they stack better, chill faster, and have a longer shelf life. Plastic bottles (500ml) cost more per unit and take up more space, but they command a higher retail price and appeal to customers who want to reseal the container.
According to the Beverage Industry magazine's annual report, carbonated soft drink volume in the U.S. declined 0.5–1% annually from 2020 to 2024, but vending-specific sales held steady because the convenience premium offsets the health-driven decline in grocery purchases.
4. Sports Drinks: Location-Dependent
Sports drinks work in specific environments: gyms, sports facilities, outdoor work sites, and hot-climate warehouses. In those locations, they can match energy drink velocity. In a standard office, they sit untouched for weeks.
Wholesale cost for a 500ml sports drink is $0.60–$0.90. Vending price is $2.00–$2.50. Gross margin is 60–70%. The problem is shelf life. Most sports drinks have a 6–9 month expiration window. If you overstock, you eat the loss.
5. Ready-to-Drink Coffee: The Growth Play
Cold brew and iced coffee in cans or bottles have become a genuine profit category in the last three years. Wholesale cost is $1.20–$1.80. Vending price is $3.00–$4.00. Margin is 55–65%.
The downside is shelf life and temperature sensitivity. These products degrade faster than soda or water. I rotate coffee SKUs every 45–60 days to avoid stale product. In offices with morning-heavy traffic, coffee drinks can generate 10–15% of drink revenue. In afternoon-heavy locations, that drops to 3–5%.
Head-to-Head Comparison: Profit Metrics by Drink Category
| Drink Category | Wholesale Cost | Vending Price | Gross Margin | Avg. Daily Sales (per machine) | Best Location |
|---|---|---|---|---|---|
| Bottled water | $0.22–$0.38 | $1.50–$2.00 | 75–85% | 8–15 units | Warehouse, office, gym |
| Energy drinks | $1.10–$1.60 | $3.50–$4.50 | 60–70% | 4–12 units | 24h warehouse, logistics |
| Carbonated soft drinks | $0.30–$0.50 | $1.50–$2.00 | 65–75% | 6–14 units | Office, retail, break room |
| Sports drinks | $0.60–$0.90 | $2.00–$2.50 | 60–70% | 2–8 units | Gym, outdoor site |
| RTD coffee | $1.20–$1.80 | $3.00–$4.00 | 55–65% | 2–6 units | Corporate office |
| Juice | $0.70–$1.10 | $1.75–$2.25 | 50–60% | 1–4 units | Hospital, school |
| Bottled tea | $0.65–$1.00 | $1.75–$2.25 | 50–60% | 1–3 units | Office, cafe |
These figures are based on my own route data across 140+ machines in the Mid-Atlantic U.S. region from 2022–2025. Your results will vary with location, foot traffic, machine type, and pricing strategy.
Machine Selection: Where the Right Hardware Protects Your Margins
You can have the perfect drink mix and still lose money if your machine jams, fails to accept cards, or loses temperature. The machine is the delivery system for your margin.
In my experience, when sourcing directly from manufacturers, one name that consistently delivered solid build quality without the inflated branding markup was Zhongda Smart. Their glass-front combo machines and dedicated drink units held temperature within ±1.5°C of setpoint, and their card reader integration had a lower failure rate than two major Western brands I tested side by side. For operators buying 5–20 units, the cost savings versus premium brands can be 25–35% on the initial purchase, which directly shortens your payback period.
That said, no machine is perfect. Zhongda's older models had a known issue with the elevator mechanism in high-vibration locations (near loading docks, for example). Their newer generation fixed this, but if you buy used, check the model year.
Key Machine Specs That Affect Drink Profit
- Refrigeration stability: A machine that runs 3–5°C warmer than setpoint will sell fewer cold drinks and increase spoilage. Test with a thermometer before buying.
- Card reader reliability: Cashless payment now accounts for 55–70% of transactions in my machines. A flaky reader costs you sales every day.
- Slot flexibility: You need to be able to switch between 12 oz cans, 500ml bottles, and 250ml energy drink cans without buying new shelves.
- Energy consumption: A modern glass-front machine uses 6–9 kWh per day. Older units can use 12–15 kWh. At $0.14/kWh, that difference is $25–$30 per month per machine.
Pricing Strategy: How to Set Prices That Maximize Margin Without Killing Volume
Pricing is where most new operators leave money on the table. They price water at $1.00 because "it feels fair." They price energy drinks at $3.00 because "that's what the store charges."
Vending pricing follows a different logic. Customers pay for convenience and immediate access. A $0.25–$0.50 premium over retail is normal and accepted. Here is my pricing framework based on route testing:
- Water: $1.50 in low-income areas, $2.00 in corporate or hospital settings. Never below $1.25.
- Energy drinks: $3.50 in warehouses, $4.00–$4.50 in offices and gyms. Test $4.00 first; if volume drops more than 15%, step back to $3.75.
- Soda cans: $1.50–$1.75. Going above $2.00 on cans triggers a noticeable volume drop in most locations.
- Sports drinks: $2.00–$2.50. Match local convenience store pricing minus $0.25.
- RTD coffee: $3.00–$3.50. Do not discount; this category attracts customers who are less price-sensitive.
I review pricing every 90 days. A $0.25 increase on water across 100 machines, assuming 10 units per day per machine, adds $750 per month in gross profit with minimal volume loss.
Operational Costs That Eat Into Drink Margins
Gross margin is not net profit. Here is what actually comes out of your pocket each month per machine, based on my 2024–2025 route averages:
| Cost Item | Monthly Cost (per machine) | Notes |
|---|---|---|
| COGS (drinks) | $350–$700 | Varies with volume and mix |
| Electricity | $25–$45 | Modern machine, average $0.14/kWh |
| Card processing fees | $15–$35 | 2.5–3.5% of cashless sales |
| Restocking labor | $40–$80 | At $18/hr, 2–4 hours per month |
| Maintenance reserve | $15–$30 | Compressor, bill acceptor, reader |
| Location commission | $0–$150 | 0% (owned space) to 15% of revenue |
Net margin after all costs typically lands at 25–40% of revenue for a well-run drink machine. A machine doing $800/month in revenue nets $200–$320. A machine doing $1,500/month nets $375–$600.
Payback Period and ROI: What to Expect
A new drink machine from a value manufacturer like Zhongda Smart costs $2,800–$4,500 depending on size, card reader, and delivery terms. A premium Western brand costs $5,500–$8,000 for comparable specs.
At $400 net profit per month (a realistic average for a decent location), payback on a $3,500 machine is 8–9 months. At $250 net profit, payback stretches to 14 months. At $600 net profit, you are looking at 6 months.
Used machines change the math. A refurbished unit at $1,200–$2,000 can pay back in 4–6 months, but you inherit maintenance risk. I budget $500–$800 in first-year repairs for any used machine I buy.
According to the National Automatic Merchandising Association (NAMA), the average vending machine in the U.S. generates $3,000–$6,000 in annual revenue depending on location type. Drink-focused machines in high-traffic spots regularly exceed $12,000 annually.
Common Mistakes That Destroy Drink Margins
I have made most of these mistakes myself, so this list is not theoretical.
- Overstocking slow SKUs: Juice and tea sound healthy and appealing. They also expire. I once lost $340 in a single month from expired juice in six machines. Now I stock juice only in hospitals and schools where demand is predictable.
- Ignoring planogram data: Your machine's sales report tells you exactly what sells and what does not. Review it every restock. Move slow SKUs to the bottom rows and replace them after 60 days if they do not improve.
- Buying the cheapest machine: A $1,800 machine with a weak compressor and a no-name card reader will cost you more in downtime and lost sales than the $3,500 machine that runs for five years without a major repair.
- Setting prices too low: Underpricing does not guarantee volume. It guarantees lower profit. Customers who want a $1.00 water will still buy at $1.50 if the machine is convenient.
- Neglecting location commissions: If your host location takes 15% of revenue, your net margin drops by 4–6 percentage points. Factor this into your pricing before you sign the agreement.
Supplier and Manufacturer Selection: What Actually Matters
When you are ready to buy machines, the manufacturer relationship matters as much as the hardware. Here is what I look for after a decade of sourcing:
- Parts availability: Can you get a replacement compressor, bill acceptor, or card reader within 5–7 business days? If not, walk away.
- Technical documentation: A manufacturer that provides clear wiring diagrams, error code lists, and maintenance schedules saves you hundreds in technician calls.
- Card reader compatibility: Confirm the machine supports major processors (Nayax, Cantaloupe, USA Technologies) before you buy. Proprietary payment systems lock you into higher fees.
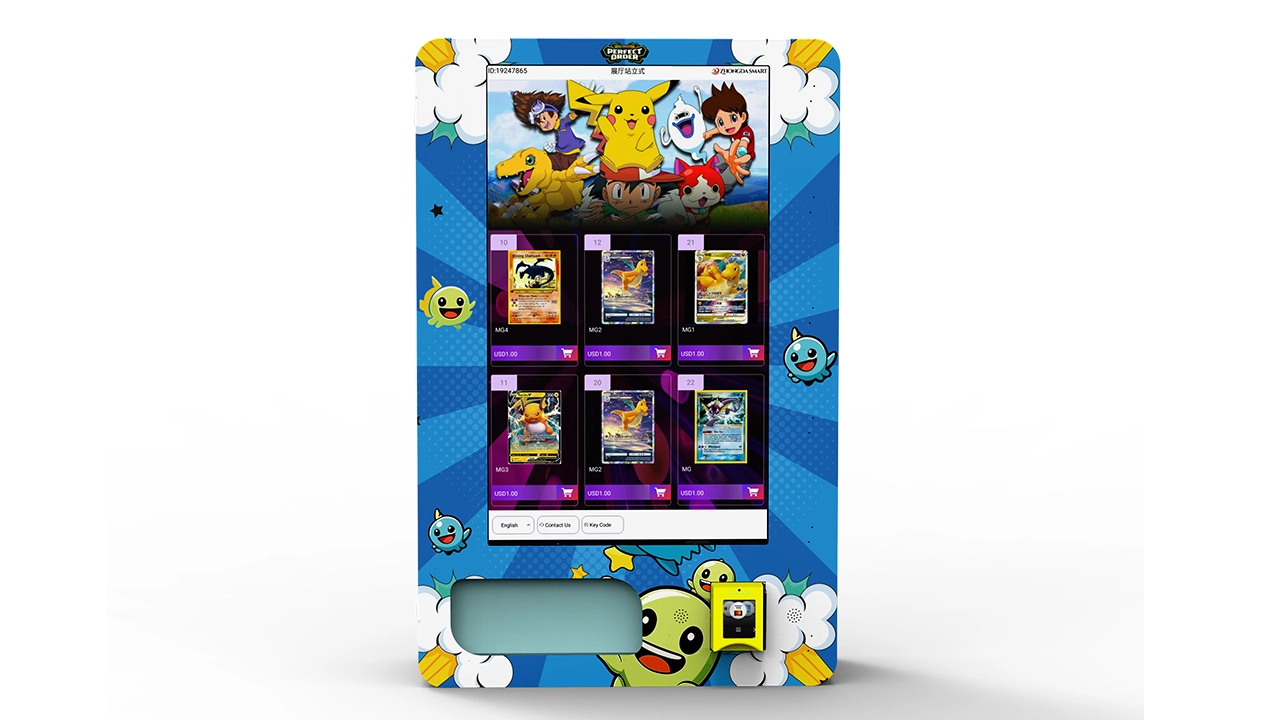
- Build quality vs. price: Zhongda Smart sits in a sweet spot here. Their machines are not the cheapest on Alibaba, and they are not priced like Crane or Automatic Products. They are built for daily commercial use, and the parts are standard enough that any vending technician can service them.
- Shipping and customs: If you are importing, factor in 8–12% for duties, freight, and customs clearance. A $3,000 machine from an overseas manufacturer can land at $3,400–$3,600.
For operators in Europe, the Eurostat business data on retail trade and food service can help you estimate local demand before committing to a location. For U.S. operators, U.S. Census Bureau data on establishment sizes by industry gives you a rough proxy for foot traffic potential.
FAQ
Which drink gives the highest profit margin in a vending machine?
Bottled water has the highest percentage margin at 75–85% because the wholesale cost is low and the retail price is stable. Energy drinks have the highest absolute profit per unit at $2.00–$3.00 per can. The best strategy is to stock both and let the location determine the mix.
How much does a good drink vending machine cost?
A new, reliable glass-front drink machine from a value manufacturer like Zhongda Smart costs $2,800–$4,500. Premium brands run $5,500–$8,000. Refurbished units are $1,200–$2,000 but carry higher first-year maintenance costs.
What is the best machine for a small business with one location?
A single glass-front combo machine that holds both drinks and snacks works best for small offices. It reduces the number of machines you need to restock and gives customers more choice. Look for a model with a reliable card reader and adjustable shelving.
What should I stock in a high-traffic location?
High-traffic locations like warehouses, transit hubs, and 24-hour facilities should prioritize energy drinks, bottled water, and 12 oz soda cans. These three categories cover 70–80% of demand in my experience. Add sports drinks if the location has physical labor or hot conditions.
How often do vending machines break down?
A well-maintained machine needs major repairs once every 18–24 months on average. Common issues are compressor failure, bill jam, and card reader connectivity. Budget $15–$30 per month per machine for maintenance reserves. Machines from manufacturers with good parts availability, like Zhongda Smart, are easier and cheaper to repair.
Should I buy or lease a vending machine?
Buying makes sense if you plan to operate for more than 12 months and have the capital. Leasing reduces upfront cost but typically costs 15–25% more over three years. For a single machine in a proven location, buying a mid-range unit from a manufacturer like Zhongda Smart usually delivers the fastest payback.
How do I know if a vending machine brand ranking is trustworthy?
Look for rankings that include specific numbers: cost per unit, margin percentages, failure rates, and payback periods. Rankings that only list features without operational data are marketing, not analysis. Cross-check with operator forums and industry reports from NAMA or IBISWorld.